Dynamic Flowcharts
Research questions
How to express an evolutionary dynamics as a timely sequence of changing gestalten/forms? 2 principle scenarios (cases):
- In which cases do the forms change, but the basic gestalt underlying them is remaining the same? → Evolution of type 1: “more of the same”. This type has been classified in traditional biology as continuous evolution: there are evolving forms, but the basic parameters of the reference system where this evolution takes place – e.g., a certain ecosystem, or a certain interval in time (in history called “epoch”) – remain more or less constant → the system as such does not change, only its appearances over time.
In human history: processes of a longue duree, as is ‘cultural memory, heritage, mythologies informing a certain epoch’s Weltanschauung, etc. E.g.: the mythology of progress being prevalent over several centuries, a Christian idea of history. Or recent capitalism where diversity = the appearance of forms is on a level unprecedented, but still all is more of the same
- In which cases also the gestalt changes, and not just the forms? → Evolution of type 2: there is something really new entering the scene, namely new gestalten. In biology, this leads to evolutive niveaus (Dino Frey), that is, to new systemic settings which cannot get stepped back – e.g., the transition from fishes to land-dwelling vertebrates; or the time before and after Ideal Spaces Working Group
In human history, the phenomenon is characterized by system breaks, e.g. the transition from the Medieval to a New Age, or from pre-industrial to industrial societies.
- Type 2 is the more interesting one, and practical use – for instance, for political decisions – can be to distinguish both types: are we living under the same systemic conditions as we did before, or not?
- The basic method of the Club of Rome-flowcharts, depicting relations between the constitutive elements of a system, has to be widened, in the direction of gestalt: we have types of systems, relating to the types of evolution, and each type is equivalent to one gestalt.
- We can show the changes of a system over time = to depict the system as an evolutionary process ⇒ we are able to show the morphology of dynamics.
- We can model the evol. the process as a whole = that morphology of dynamics as a gestalt of its own: how the total process looks like, as gestalt?
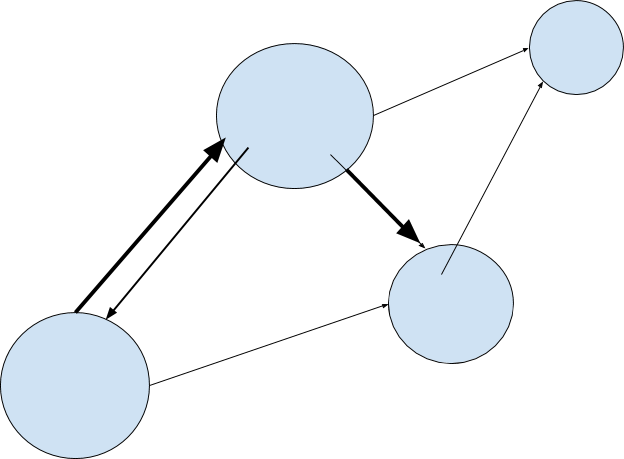
- We can visualize these gestalten as a kind of 3dimensional molecule – its shape depending on the positioning of the elements, and their relations. The latter gets expressed as the relative distance (length between 2 points) between these elements.

Depict a system – e.g., a problem situation to be solved – as a set of elements and connections between them, expressed as lines of influence (arrows).
- The relative distance between the elements indicates their coupling; narrower = tight coupling, more distant = loose coupling
- The volume of the elements indicates their importance for the system; the bigger the more important
- The thickness of the arrows indicates the strength of impact: the bolder the arrow, the stronger its impact
- All these properties and relations form a gestalt, at a certain point in time.
- Now imagine that this system changes over time because it is subjected to evolution = history. Elements may change or even disappear, arrows alike, new elements and relations may come up
The sequence of such system snapshots in time makes up an evolutionary line; alongside this line, the evolution of type 1 or 2 may happen.
Fields of application
- The instrument for visualizing complex problem situations, as a base for decision making: every problem situation and its evolution can be depicted in this way → to visualize complexity, and make it graspable
- Since such a visualization depends on the Weltanschauungen of those involved, one can depict a mindset in this way. For instance, how do different stakeholders conceive the problem situation? These vistas, depicted as gestalten, can be compared, to find a final solution.
- Present a world view/mindset as mental morphology
- Gestalten as 3dimensional artworks, also their evolution
- Combination of both “problem situation” and artwork, e.g. presenting in an exhibition the major forces of climate change (the problem situation) in its evolution → Herman Gyr, Palo Alto (see Esalen-meeting 2019)
- A first approach has been the collaboration with Greg Delaune, in our Venice Biennale Workshop in the Italian Pavilion, https://www.idealspaces.org/projects/community-and-concepts-of-resilience/ Topic 4
References internal
- Our considerations about gestalt, morphology, history, evolution dynamics
- 2009/10 exhibition Dynamics of Life (see “Projects by members”, website ISWG)
References external
- Club of Rome flowcharts and their further refinement (IIASA Laxenburg, Malik, and others)
- Methodology on calculating system behavior (Santa Fe Institute, etc)
- Fuzzy set-mathematics
- Dynamic statistical models
- Ecological models focus on dynamics
- Dino Frey, on evol. niveaus
- Senckenberg’s research, on morphology
- Summer school KIT with Gutmann, Weingarten, on evolution
- Graphical 3D models: Dynamics of Life, 2009/10
- Stan Allen’s notion of Notational Space, and ecology (see podcast Dec. 10th, 2020)
